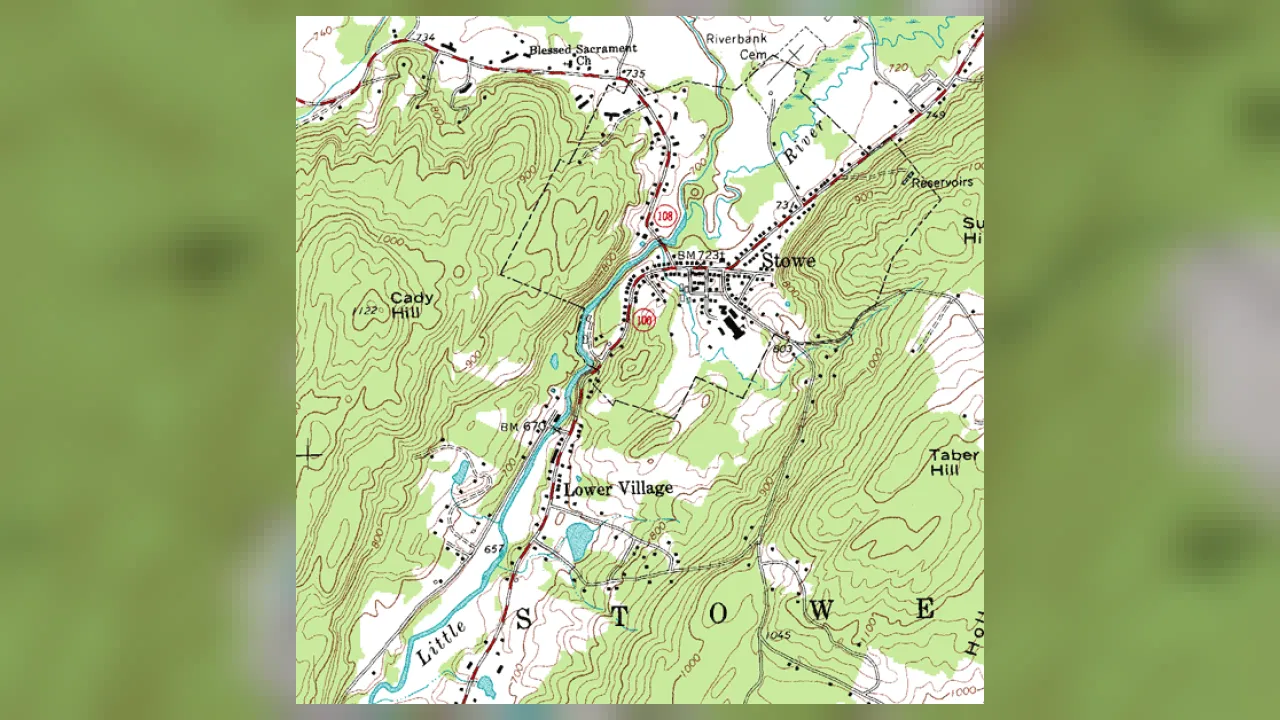
1. What do contour lines squished very close together on a map mean?
2. What does the smallest closed loop in the middle of a hill's rings usually mark?
🤯 Mind-Blowing Fact • Grade 2
Contour lines can never cross over one another on an ordinary hill because one single spot on the ground cannot have two different heights at once!
✨ Word Sparks (Grade 2 Glossary)
Tap 🔊 to hear
Topographic
Showing surface shapes and heights of land
Elevation
Height of land above ocean sea level
Sea Level
Average ocean height used as zero feet
🪝
What if you dipped a lumpy clay island into bathwater one inch at a time and traced every water ring?
1
Tracing Equal Heights
Imagine sculpting a bumpy clay mountain inside a clear tub! Pour in one inch of water and draw a line right along the water's edge. Add another inch of water and draw a second ring higher up. Viewed from straight overhead, those rings create a map!
2
Every Point Shares One Elevation
Each wavy brown contour line connects spots that sit at the exact same height—or —above . Walk all the way around one contour loop on a real hillside, and you will never climb up or down!
3
Planning Smart Hikes
Park rangers and hikers check spacing before picking a trail. Wide spaces between lines promise an easy stroll, while crowded lines warn of a huff-and-puff climb!
1. If you walk directly along one single contour line on a mountain, what happens to your height?
2. What does wide open space between contour lines tell a hiker?
🤯 Mind-Blowing Fact • Grade 3
Using airborne lasers called LiDAR that pulse hundreds of thousands of light beams per second through forest leaves, modern mapmakers measure ground heights down to a few centimeters!
✨ Word Sparks (Grade 3 Glossary)
Tap 🔊 to hear
Contour Interval
Height step between two neighboring contour lines
Index Contour
Bold every-fifth contour line labeled with height
Hachures
Tiny inward ticks marking a sunken pit
🪝
How can V-shaped bends on a paper map tell you which way a mountain creek flows—even without arrows?
1
Counting by the Contour Interval
Check the bottom margin of a topographic map, and you will spot a key rule called the —such as 20 feet or 40 feet. That number tells the exact vertical step in elevation from one brown line to its neighbor! Every fifth line, called an , is printed thicker and labeled with its height.
2
The Secret 'Rule of Vs'
Whenever contour lines cross a stream valley, they bend into sharp V shapes! Here is the cool trick: the pointy tip of every V points UPSTREAM toward higher ground, so water always flows out of the open mouth of the V!
3
Spotting Craters and Sinkholes
What if concentric circles actually dip DOWN into a volcanic crater or sinkhole instead of rising up a hill? Cartographers draw tiny short tick marks called pointing inward around depression rings!
4
Colors With Meaning
Standard U.S. topographic maps print contours in brown, rivers and lakes in blue, forests in green, and roads or buildings in black and red.
1. When contour lines bend into V shapes across a blue river line, which way do the pointy tips of the Vs point?
2. How does a topographic map show a sunken bowl like a sinkhole or crater instead of a hill?
🤯 Mind-Blowing Fact • Grade 4
French engineer Jean-Louis Dupain-Triel published one of the earliest land contour maps of France in 1791 after borrowing the idea from Dutch sailors who connected equal river-depth numbers to avoid sandbars!
✨ Word Sparks (Grade 4 Glossary)
Tap 🔊 to hear
Gradient
Steepness found by dividing rise by distance
Profile
Side-view outline of hills and valleys
Bathymetric
Mapping underwater depths of oceans and lakes
🪝
How do engineers use topographic contour maps to design safe mountain highways, flood zones, and hiking switchbacks?
1
Decoding Virginia Landforms From Above
Spread out a U.S. Geological Survey (USGS) quadrangle map of Virginia's Shenandoah Valley and Blue Ridge Mountains, and centuries of Earth science leap off the page! Long, parallel, tightly packed contour ridges trace erosion-resistant sandstone and granite peaks like Old Rag Mountain, while wide-spaced loops carrying little hachure ticks across the valley floor reveal limestone karst sinkholes.
2
Calculating Slope Gradient and Profiles
Earth scientists use contour maps quantitatively. If an index contour reads 1,000 feet and the next reads 1,200 feet across five intervals, each contour step equals 40 feet. Dividing elevation change ('rise') by horizontal map-scale distance ('run') yields slope —telling civil engineers where to carve gentle zig-zag switchbacks so trucks and hikers can climb safely!
3
Drawing a Side-View Topographic Profile
Lay the edge of a scrap strip of paper across a map, mark every spot where a contour line touches the paper, and plot those heights on graph paper: suddenly a top-down map transforms into a side-view silhouette of peaks and valleys!
4
Bathymetric Contours Beneath the Waves
Oceanographers extend the exact same method underwater! Using sonar echoes, maps draw equal-depth contours—isobaths—revealing continental shelves, submarine canyons, and mid-ocean ridges.
1. If two bold index contours labeled 400 feet and 500 feet have five spaces between them, what is the map's contour interval?
2. What do oceanographers call an underwater map that uses contour lines to show ocean depths?
🤯 Mind-Blowing Fact • Grade 5
Airborne LiDAR contour mapping has uncovered entire lost Maya cities, ancient roads, and agricultural terraces hidden invisibly beneath dense Central American jungle canopies!
✨ Word Sparks (Grade 5 Glossary)
Tap 🔊 to hear
Isoline
Map line connecting points of equal measurement
Datum
Official zero-elevation sea-level reference surface
LiDAR
Laser-pulse technology measuring exact 3D ground heights
🪝
How did weighing a whole Scottish mountain in 1774 give birth to modern scientific contour lines?
1
Charles Hutton and the Schiehallion Experiment
In 1774, British astronomers traveled to steep Mount Schiehallion in Scotland to measure how the mountain's rock mass pulled a pendulum slightly sideways—a clever test to calculate Earth's average density! Mathematician Charles Hutton faced thousands of scattered survey heights on paper until he hit upon a breakthrough: connecting points of equal elevation with smooth curves so he could slice the mountain mathematically into measurable horizontal slabs!
2
Isolines Across Earth Science
Hutton's elevation curves belong to a broader family of scientific '' (lines of equal value): topographic maps plot contours (isohypses) of equal elevation above a vertical geoid ; bathymetric charts plot isobaths of equal water depth; weather maps plot isobars of equal air pressure and isotherms of equal temperature. Mastering one lets you read them all!
3
Geomorphic Signatures and Watershed Delineation
Trained geologists read landscape processes directly from contour geometry. Glacially carved alpine valleys display flat U-shaped bottoms framed by cliff-tight walls, whereas river-cut canyons display sharp V-shaped bottoms. By tracing ridge crests perpendicular to contours from saddle to summit, hydrologists delineate exact watershed divides showing where every raindrop drains.
4
The Rare Case Where Contours Touch
Remember how contours almost never meet? Two exceptions prove the geometric rule: along a completely vertical 90-degree rock cliff, multiple elevation contours stack directly atop one another into a single merged line; on a jutting overhanging cliff ledge, lower contours briefly pass underneath higher ones (drawn dashed)!
5
From Photogrammetry to LiDAR Digital Elevation Models
While twentieth-century USGS 1:24,000-scale 7.5-minute quadrangles relied on stereoscopic aerial photographs, today's 3D Elevation Program (3DEP) fires airborne laser pulses that filter past forest canopies to map bare-earth terrain, landslides, and coastal floodplains with sub-meter vertical accuracy.