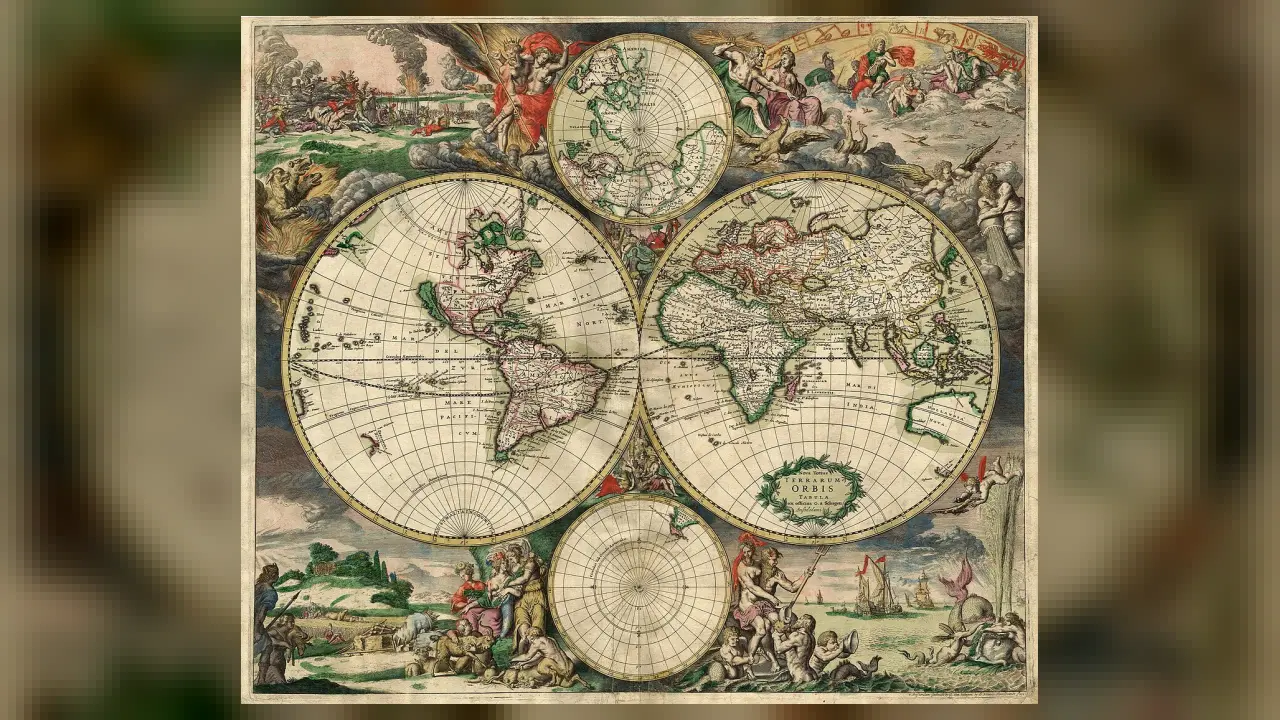
2. Which part of a map shows north, south, east, and west?
🤯 Mind-Blowing Fact • Grade 2
More than eighty percent of Earth's deep ocean floor still hasn't been mapped in crisp detail—so underwater mapmakers make new discoveries every month!
✨ Word Sparks (Grade 2 Glossary)
Tap 🔊 to hear
legend
A map box explaining colors and symbols
scale
Shows how map distance matches real miles
satellite
A spacecraft orbiting Earth taking high photos
🪝
Since people explored every continent long ago, why do we still need thousands of mapmakers today?
1
A World That Keeps Changing
Every single year, builders pave new roads, rivers shift their sandy banks, and towns grow wider! Keeping every paper atlas and phone screen up to date is the exciting work of a cartographer—the science word for mapmaker.
2
Keys and Scales
Great maps pack huge facts into neat spaces without getting messy. A map (or key) explains what tiny airplane, tent, or tree icons mean. Nearby, a map shows how one inch on paper equals miles in real life.
3
Eyes in the Sky
Long ago, explorers measured coastlines from wooden ships. Today, mapmakers combine photos, flying drones, and GPS signals!
On many flat classroom wall maps, icy Greenland looks almost as big as Africa—even though on a round globe Africa is actually fourteen times larger!
✨ Word Sparks (Grade 3 Glossary)
Tap 🔊 to hear
latitude
Imaginary lines measuring north or south
contour line
Curved map line showing hill height
GIS
Computer software stacking smart map data layers
🪝
Why is it impossible to flatten an orange peel—or a round Earth—onto a flat map without stretching something?
1
The Orange-Peel Puzzle
Try peeling an orange and pressing the curved skin completely flat on a table—it rips or stretches! Because Earth is a round sphere, every cartographer faces that exact geometry puzzle when drawing a flat world map.
2
Latitude, Longitude, and Elevation
To pinpoint any spot on Earth, mapmakers use an invisible grid of lines running east–west and longitude lines running north–south. On hiking maps, curved '' connect points of equal height—when lines crowd close together, watch out for a steep cliff!
3
Layering Smart Maps with GIS
Modern mapmakers use Geographic Information Systems () on powerful computers. They stack invisible data layers—roads, streams, soil types, and fire hydrants—to help firefighters and city planners solve problems fast.
4
Art Meets Math
Choosing clear fonts and gentle colors takes artistic skill too, especially so color-blind readers can read every trail and weather zone easily!
1. Why does Greenland look way too huge on some flat rectangular world maps?
2. What do closely packed contour lines on a hiking map warn you about?
🤯 Mind-Blowing Fact • Grade 4
In 1612, explorer John Smith published a remarkably accurate map of Virginia's Chesapeake Bay and over 200 Indigenous Powhatan towns that guided travelers for decades!
✨ Word Sparks (Grade 4 Glossary)
Tap 🔊 to hear
map projection
A math method turning globes into flat maps
sonar
Using sound echoes to measure underwater depth
topography
The natural and built surface shapes of land
🪝
How did Oceanographer Marie Tharp map unseen mountains under the Atlantic—and how do modern cartographers guide emergency rescues?
1
Revealing Hidden Landscapes
In the 1950s, most scientists assumed the deep Atlantic Ocean floor was a flat, featureless plain of mud. Plotting thousands of ship pings by hand, geologist and oceanographic cartographer Marie Tharp uncovered a 40,000-mile underwater mountain range and rift valley—helping prove that Earth's continents drift!
2
Map Projections Have Jobs to Do
Because flattening a 3D globe onto a 2D sheet distorts either shape, area, distance, or direction, cartographers select specific mathematical 'projections' for each job. Sailors liked Gerardus Mercator's 1569 projection because compass bearings stayed straight lines, whereas classroom atlases often prefer equal-area or Winkel tripel projections that show continents in realistic proportions.
3
Real-Time Geospatial Rescue
When hurricanes approach Virginia's Chesapeake Bay or wildfires spark out West, GIS cartographers combine live weather radar, land elevation data, bridge heights, and hospital locations into interactive emergency dashboards. Within minutes, dispatchers see which coastal roads may flood first and route ambulances and rescue crews safely.
4
Charting Other Worlds
At the U.S. Geological Survey's Astrogeology Science Center, planetary cartographers turn NASA orbiter photos and laser altimeter readings into detailed landing maps so Mars rovers and lunar landers avoid sharp boulders and steep craters!
1. How did cartographer Marie Tharp change Earth science in the 1950s?
2. How do GIS cartographers help during hurricanes or floods?
🤯 Mind-Blowing Fact • Grade 5
Around 240 BCE, Greek scholar and mapmaker Eratosthenes measured midday shadow angles in two Egyptian cities and calculated Earth's 24,901-mile circumference within a few percent—using zero satellites!
✨ Word Sparks (Grade 5 Glossary)
Tap 🔊 to hear
geodesy
Measuring Earth's exact shape, size, and gravity
bathymetry
Mapping underwater depths of oceans and lakes
thematic map
A map showing patterns like weather or health
🪝
How do geodesy, atomic-clock satellites, and perceptual design power every turn-by-turn map in our pockets?
1
Billions of Pixels, One Clear Story
Open a mobile navigation app or live wildfire tracker and an effortless map appears in half a second. Behind that clean screen, cartographers and geospatial engineers fuse petabytes of satellite imagery, airborne LiDAR point clouds, street-sensor telemetry, and visual hierarchy rules so human eyes grasp complex spatial patterns instantly.
2
From Clay Tablets to Geodesy
Human mapmaking stretches from 2,600-year-old Babylonian clay tablets and Eratosthenes' remarkably close calculation of Earth's circumference around 240 BCE to modern —the precise measurement of Earth's slightly flattened, wobbling shape (an oblate spheroid). Today, constellations of Global Positioning System (GPS) satellites carrying atomic clocks broadcast radio timestamps that let survey receivers pinpoint coordinates within centimeters.
3
Remote Sensing and Bathymetry
Contemporary cartographers rarely rely on ordinary photographs alone. Multispectral satellites measure invisible infrared wavelengths reflected by crops, wetlands, and forests to map drought stress weeks before leaves turn brown, while multibeam sonar ships sweep fans of sound waves across deep ocean trenches to build high-resolution 3D bathymetric charts.
4
Thematic Cartography and Public Health
Not all maps guide highway travelers— uncover hidden cause-and-effect relationships. In 1854 London, physician John Snow plotted cholera cases as tiny black bars on a neighborhood street map and traced a deadly outbreak straight to one contaminated water pump! Modern epidemiologists, wildlife ecologists, and census analysts use choropleth and heat maps the exact same way.
5
Ethical Design Choices
Because map scale, color-blind-safe palettes, symbol sizing, and mathematical projection choices shape how citizens and leaders interpret data, skilled cartographers follow strict scientific transparency so maps inform accurately rather than mislead.