💎 EARTH SCIENCE
🪨 Köppen-Geiger Global Empirical Climate Classification System (A–E)
VA Science SOL 1.6, 2.6, 3.7, 4.4, 4.7, 5.8 (Weather, Rocks, Oceans & Earth Systems)
Köppen Climate Zones
Mapping Earth's Five Great Families of Climate
Grade 1 • Early Reader • 79 words
🌍 Earth Science TypeClimatology & Plant Geography
🌋 Where It FormsAll Continental Landmasses From Equatorial Rainforests to Polar Ice Caps
💎 Key Properties5 Main Letter Groups: A (Tropical), B (Dry), C (Temperate), D (Continental), E (Polar)
⚡ Planet Earth SparkUses temperature, rainfall, and wild plant boundaries to sort the entire planet into five easy-to-read climate families
🤯 Mind-Blowing Fact • Grade 1
Scientist Wladimir Köppen got the idea for his world climate map after noticing how plants changed as he rode trains from cold northern Europe to warm sunny coasts!
✨ Word Sparks (Grade 1 Glossary)
Tap 🔊 to hear
climate
Usual weather pattern over many years
polar
Icy cold region near Earth's poles
mild
Gentle weather, neither super hot nor freezing
🪝
Why do palm trees grow in Florida, cacti in Arizona, and snowy pines in Alaska?
1
Weather Over Many Years
Put on mittens in snowy Alaska or flip-flops in warm Hawaii! Today's sky is weather, and usual weather all year is . One smart map sorts Earth into Köppen climate zones!
2
Five Big Groups
Five letters name Earth's main homes: A is warm and rainy, B is super dry, C is , D has snowy winters, and E is icy !
3
Plants Give the Clue
Plants grow only where rain and warmth fit them best. Watching trees and bushes helped map the whole world!
2. How many main letter groups (A, B, C, D, E) organize the Köppen climate map?
🤯 Mind-Blowing Fact • Grade 2
The United States is one of the very few countries on Earth that contains examples of all five main Köppen climate zones (A, B, C, D, and E)!
✨ Word Sparks (Grade 2 Glossary)
Tap 🔊 to hear
temperate
Moderate climate with four gentle seasons
savanna
Warm tropical grassland with scattered trees
continental
Inland climate with warm summers, cold winters
🪝
How can wild plants act like living thermometers and rain gauges all over Earth?
1
Plants Tell the Climate Story
Imagine mapping every climate on Earth just by looking at what grows wild in the soil! In 1884, scientist Wladimir Köppen realized that palm trees, desert cacti, oak forests, and arctic mosses show exactly how warm and wet each region stays over decades.
2
Learning the Five Letters
Köppen used five capital letters starting near the equator and moving toward the poles. Group A covers hot, wet Tropical rainforests and . Group B marks Dry deserts and grasslands. Group C holds mild lands, Group D has snowy winters, and Group E stays Polar cold!
3
Where Does America Fit?
Because the United States is huge and varied, it actually contains ALL FIVE Köppen letter groups—from tropical southern Florida and Hawaii to icy northern Alaska!
1. Which Köppen letter group describes hot, rainy rainforests near the equator like the Amazon?
2. What clue helped Wladimir Köppen choose the boundaries between climate zones?
🤯 Mind-Blowing Fact • Grade 3
Wladimir Köppen loved studying Earth's climates so deeply that he kept refining his famous world map all the way until age ninety-four!
✨ Word Sparks (Grade 3 Glossary)
Tap 🔊 to hear
classification
System for sorting things into clear groups
precipitation
Water falling as rain, snow, or hail
evaporation
Liquid water turning into invisible vapor
🪝
How do three short letters like 'Cfa' describe Virginia's climate to any scientist in the world?
1
A Universal Climate Code
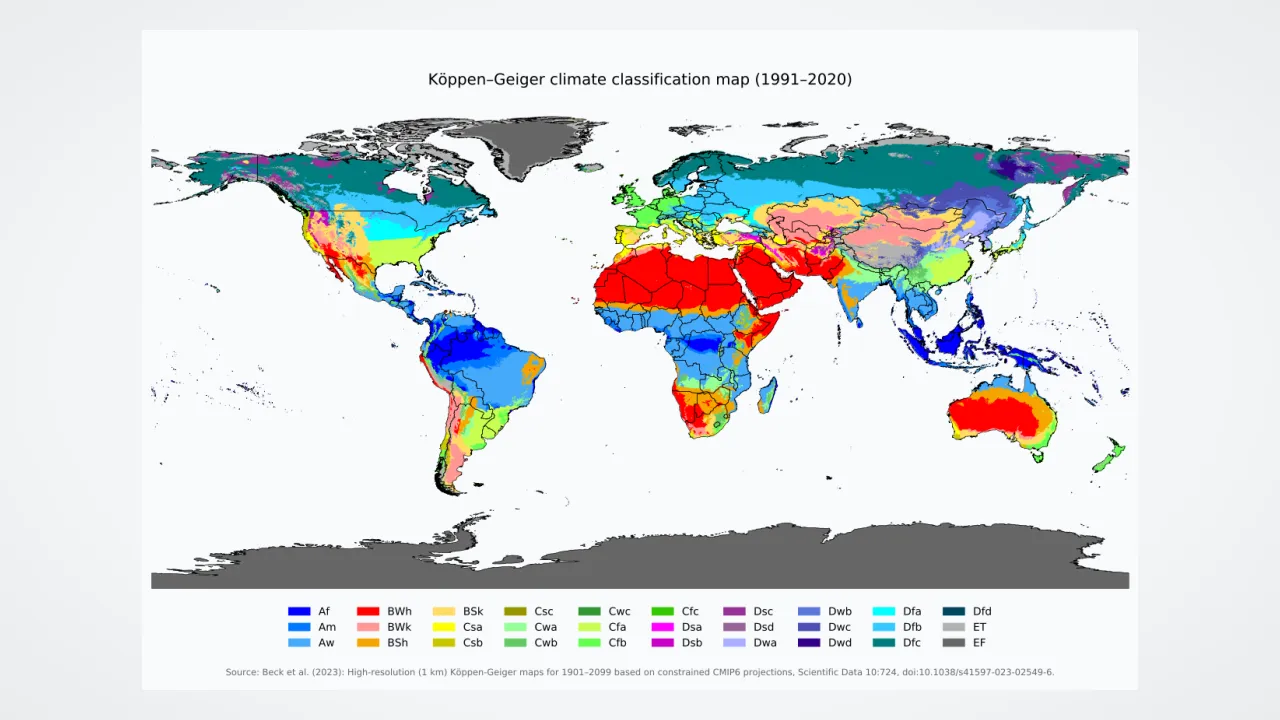
Walk into a geography classroom in Tokyo, Berlin, or Richmond, Virginia, and everyone reads the same colorful map: the Köppen-Geiger climate ! First published by Wladimir Köppen in 1884 and updated with Rudolf Geiger, this system uses thirty years of monthly temperature and averages to give every place a two- or three-letter code.
2
First Letter: The Main Family
Four of the five main letters—A (Tropical), C (Temperate), D (Continental), and E (Polar)—are chosen by monthly temperatures. Group B (Dry) is special: it is chosen when yearly beats yearly rainfall, allowing both hot Sahara deserts and cold Gobi deserts inside Group B!
3
Second and Third Letters
Smaller letters add detail! The second letter tells when rain falls: 'f' means rain all year, 's' means dry summer (like California), and 'w' means dry winter. The third letter describes summer heat, such as 'a' for hot summers!
4
Decoding 'Cfa'
Most of Virginia and the American Southeast carry code 'Cfa'—Temperate, moist all year, with hot summers!
1. Which of the five main Köppen groups is defined by dryness (low rainfall compared to evaporation) rather than temperature alone?
2. What does the three-letter Köppen code 'Cfa' tell us about most of Virginia's climate?
🤯 Mind-Blowing Fact • Grade 4
The 50 °F (10 °C) warmest-month boundary that starts Polar Group E matches the natural Arctic treeline—colder than that in summer, trees cannot build enough wood to stand tall!
✨ Word Sparks (Grade 4 Glossary)
Tap 🔊 to hear
treeline
Cold edge beyond which trees cannot grow
tundra
Treeless polar land with frozen subsoil
subtropical
Warm mild zone bordering the tropics
🪝
Why can't Group D 'Continental' climates exist widely in the Southern Hemisphere?
1
Exact Botanical Temperature Lines
Wladimir Köppen did not pick random numbers for his five groups—he matched real biological lines in nature! Group A (Tropical) requires EVERY month of the year to average 64.4 °F (18 °C) or warmer, marking where frost-sensitive palms and corals thrive. On the opposite extreme, Group E (Polar and ice caps) begins where even the warmest summer month stays colder than 50 °F (10 °C)—the exact thermal beyond which tall forest trees cannot grow!
2
Comparing Group C and Group D
Between those extremes sit two mid-latitude forest families. Group C (Temperate—including Mediterranean 'Csa/Csb' California, marine west coast Seattle, and humid 'Cfa' Virginia) has mild winters and warm summers. Group D (Continental—spanning Minnesota, New England, Canada, and Russia) features warm summers paired with snowy, freezing winters that lock lakes in ice.
3
A Southern Hemisphere Mystery Solved!
Look at a global Köppen map and spot a shock: huge purple Group D zones cover Canada and Russia, yet almost NONE appear in the Southern Hemisphere! Why? Between 40°S and 60°S latitude, Earth is covered mostly by vast oceans that moderate winter cold, with almost no wide continents!
4
Mountain Highland Climates
Many modern classroom maps also add 'H' for Highland mountain zones, where climbing a single peak in Ecuador or Colorado crosses multiple climate zones in just a few miles.
1. Why are Group D (Continental) climates huge across North America and Eurasia, yet nearly absent in the Southern Hemisphere?
2. What real-world plant boundary matches Köppen's 50 °F (10 °C) summer rule for Polar Group E?
🤯 Mind-Blowing Fact • Grade 5
Comparing historical 1900s weather records to modern satellite-era maps shows Earth's Köppen climate boundaries marching steadily poleward—and upslope on mountains—by dozens of miles per decade!
✨ Word Sparks (Grade 5 Glossary)
Tap 🔊 to hear
empirical
Based on real measured observations
isotherm
Map line connecting equal temperatures
steppe
Dry grassland bordering true deserts
🪝
How do thirty-year climate normals and shifting Köppen-Geiger maps track planetary climate change in real time?
1
Quantitative Thresholds of the 30 Subtypes
Trained in botany and meteorology at St. Petersburg and Heidelberg, Wladimir Köppen synthesized plant geography from Alphonse de Candolle with global weather station records between 1884 and 1936, joined by climatologist Rudolf Geiger. Using 30-year WMO climatological normals, the Köppen-Geiger matrix divides Earth into five primary classes and thirty sub-classifications. Group A requires coldest-month mean temperature $T_{min} \ge 18\,^{\circ}\text{C}$, subdivided into rainforest ($Af$, every month $\ge 60\text{ mm}$ rain), monsoon ($Am$), and wet-dry savanna ($Aw$). Group B uses an aridity threshold comparing annual precipitation against mean annual temperature and seasonal rain timing to separate true deserts ($BW$, German Wüste) from semi-arid ($BS$).
2
Mesothermal (C), Microthermal (D), and Polar (E) Boundaries
Humid mid- and high-latitude zones where warmest-month $T_{max} \ge 10\,^{\circ}\text{C}$ split along the winter freezing ($0\,^{\circ}\text{C}$, or $-3\,^{\circ}\text{C}$ in classic European maps): Temperate Group C ($0\,^{\circ}\text{C} < T_{min} < 18\,^{\circ}\text{C}$) versus snow-forest Continental Group D ($T_{min} \le 0\,^{\circ}\text{C}$), reaching extreme subarctic taiga ($Dfd$) in Siberia where winter means plunge below $-38\,^{\circ}\text{C}$! Beyond the $T_{max} < 10\,^{\circ}\text{C}$ treeline, Polar Group E divides into mossy tundra ($ET$, $0\,^{\circ}\text{C} < T_{max} < 10\,^{\circ}\text{C}$) and permanent ice cap ($EF$, $T_{max} \le 0\,^{\circ}\text{C}$) across Greenland and Antarctica.
3
Mediterranean vs. Humid Subtropical Contrasts
Look along $37^{\circ}\text{N}$ latitude: San Francisco and Athens sit on western continental margins cooled by ocean currents and summer subtropical highs, creating dry-summer Mediterranean climates ($Csb/Csa$), whereas Norfolk, Virginia, and Tokyo on eastern margins receive moist summer onshore flow ($Cfa$).
4
Tracking Shifting Zones via High-Resolution Grids
Modern 1-kilometer digital Köppen-Geiger maps comparing 1901–1930 against present and projected 2071–2100 baselines document measurable poleward and upslope shifts: Tropical ($A$) and Arid ($B$) belts expanding while Continental ($D$) and Polar ($E$) tundra zones contract.
5
Why Empirical Classification Endures
More than a century after Köppen's first sketch, ecologists, agronomists, and climate modelers still rely on his letter codes to translate abstract terabytes of climate-model output into tangible biome shifts!